
Overview
Data platform that digitizes business spending with strategic dashboards, and visual reports.
Designed a data platform that tracks and digitizes business spending and operational performance through automated metrics, strategic dashboards, and visual reporting as a lead designer.
End-to-end design strategy from conducting user interviews, research, and usability testing to defining the core UX flows. I built a scalable design system and shaped the overall product architecture, ensuring consistency across components while supporting complex enterprise data needs.
Client
Emburse
Service
UX/UI
Year
2025

challenge
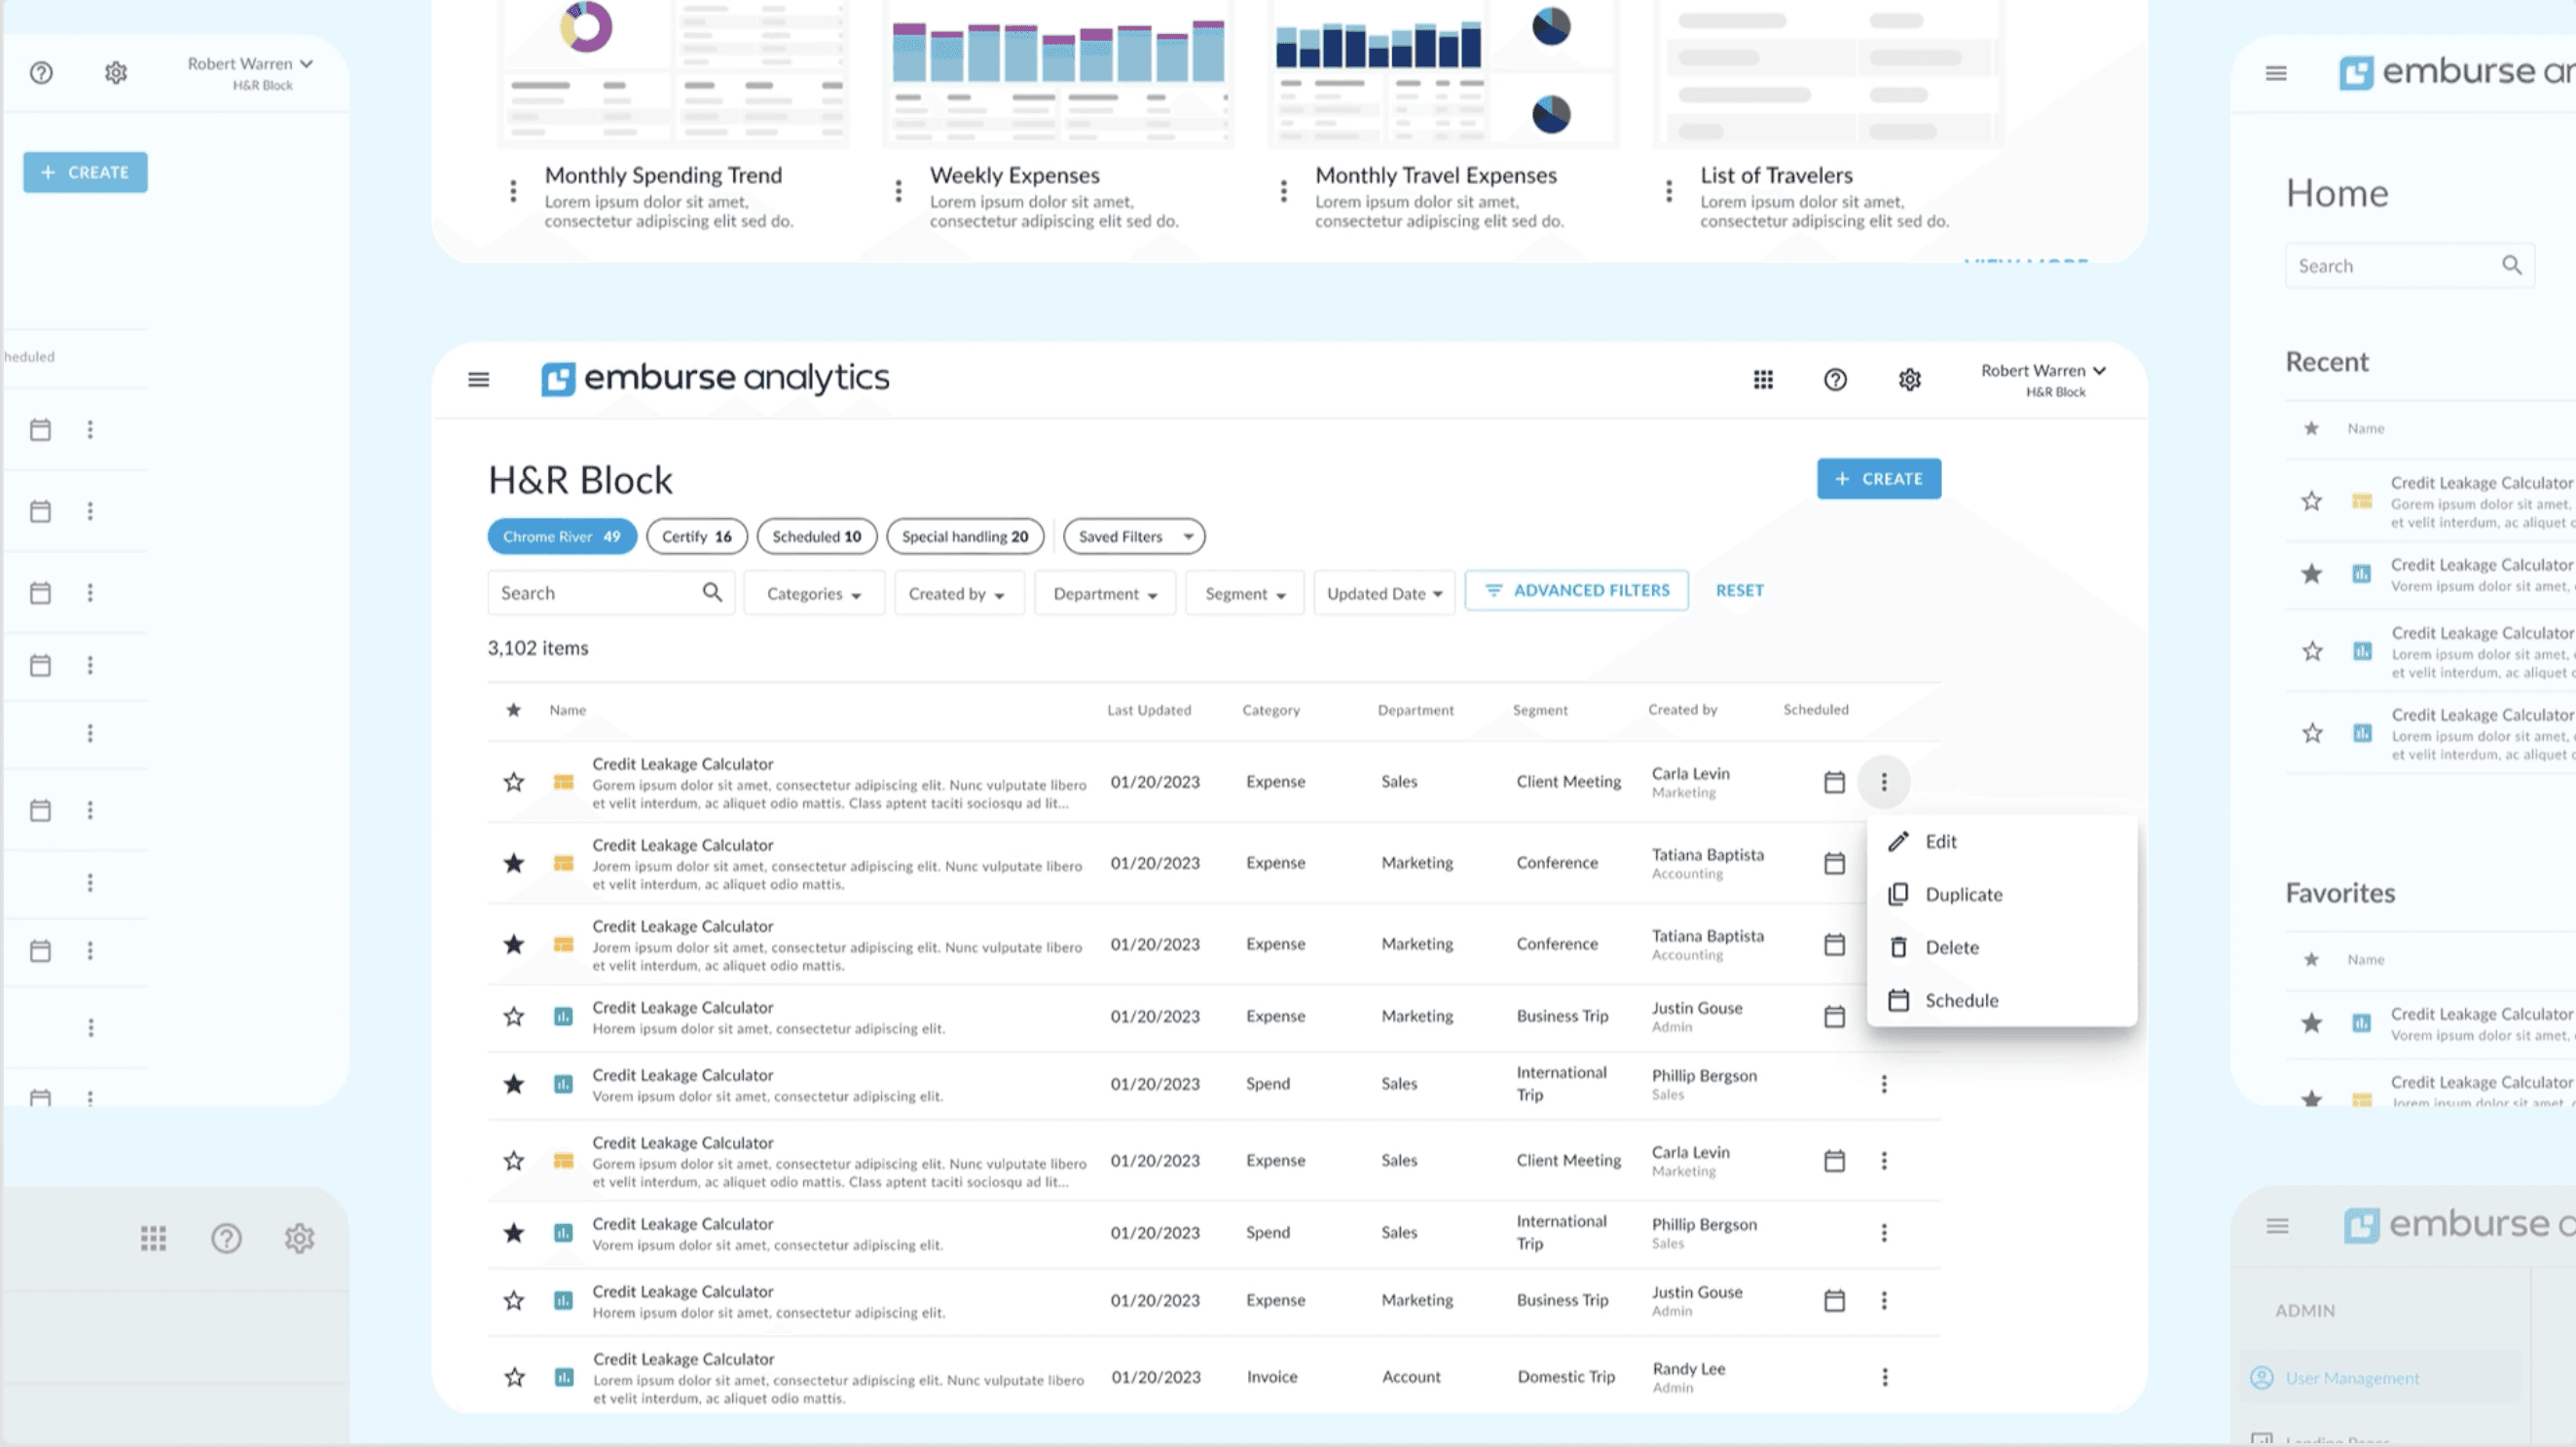
The original app was lack of sorting and filtering options so users were not able to find key data. The app had cluttered interface along with not well considered data architecture, it was not easy for users to navigate. As a result, it had steep learning curve for first time users that made user engagement very hard.
result
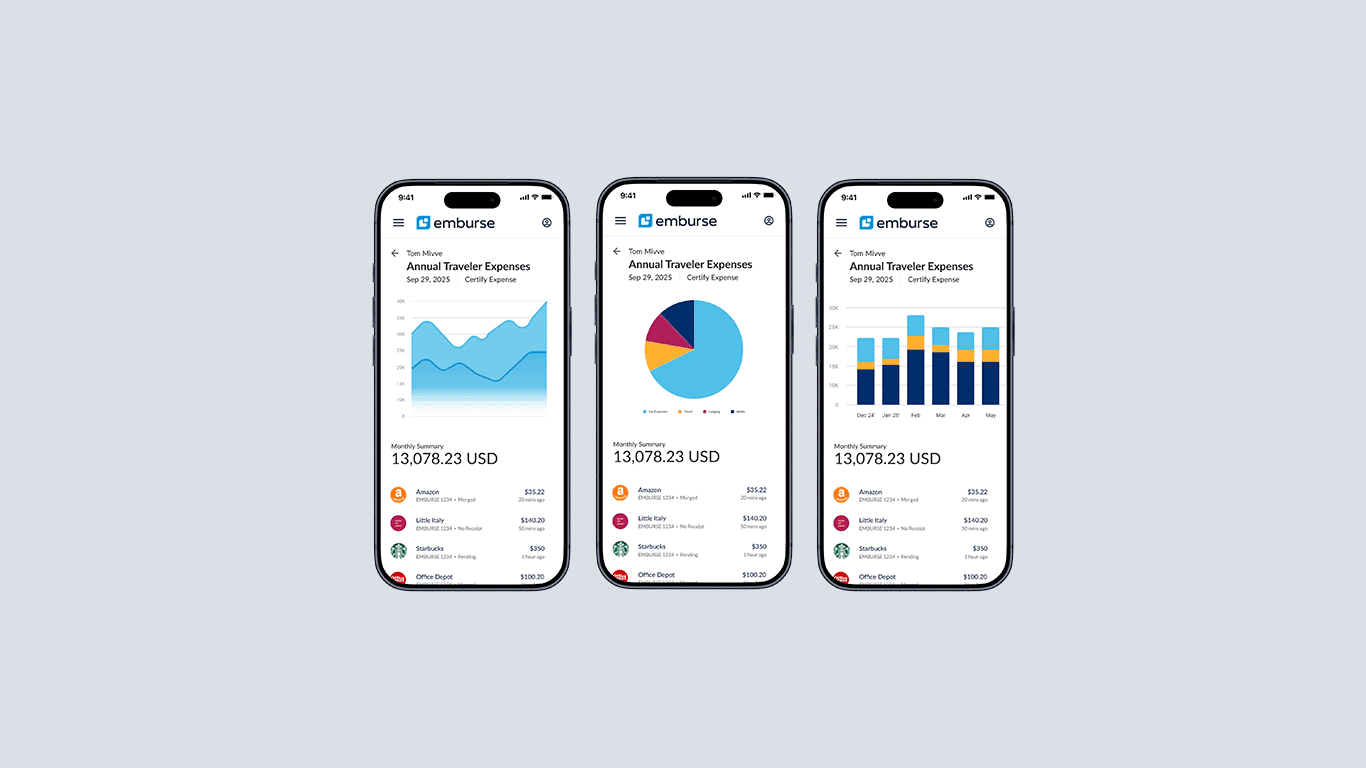
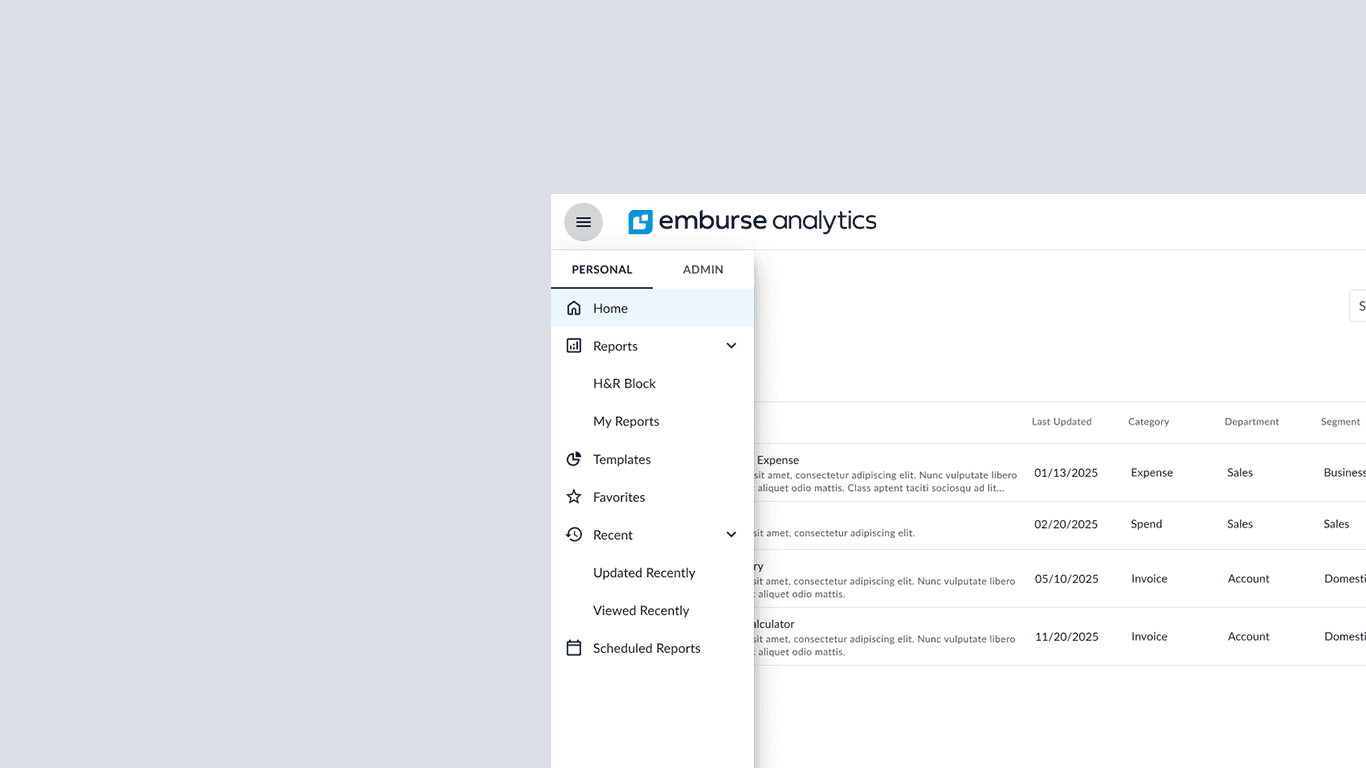
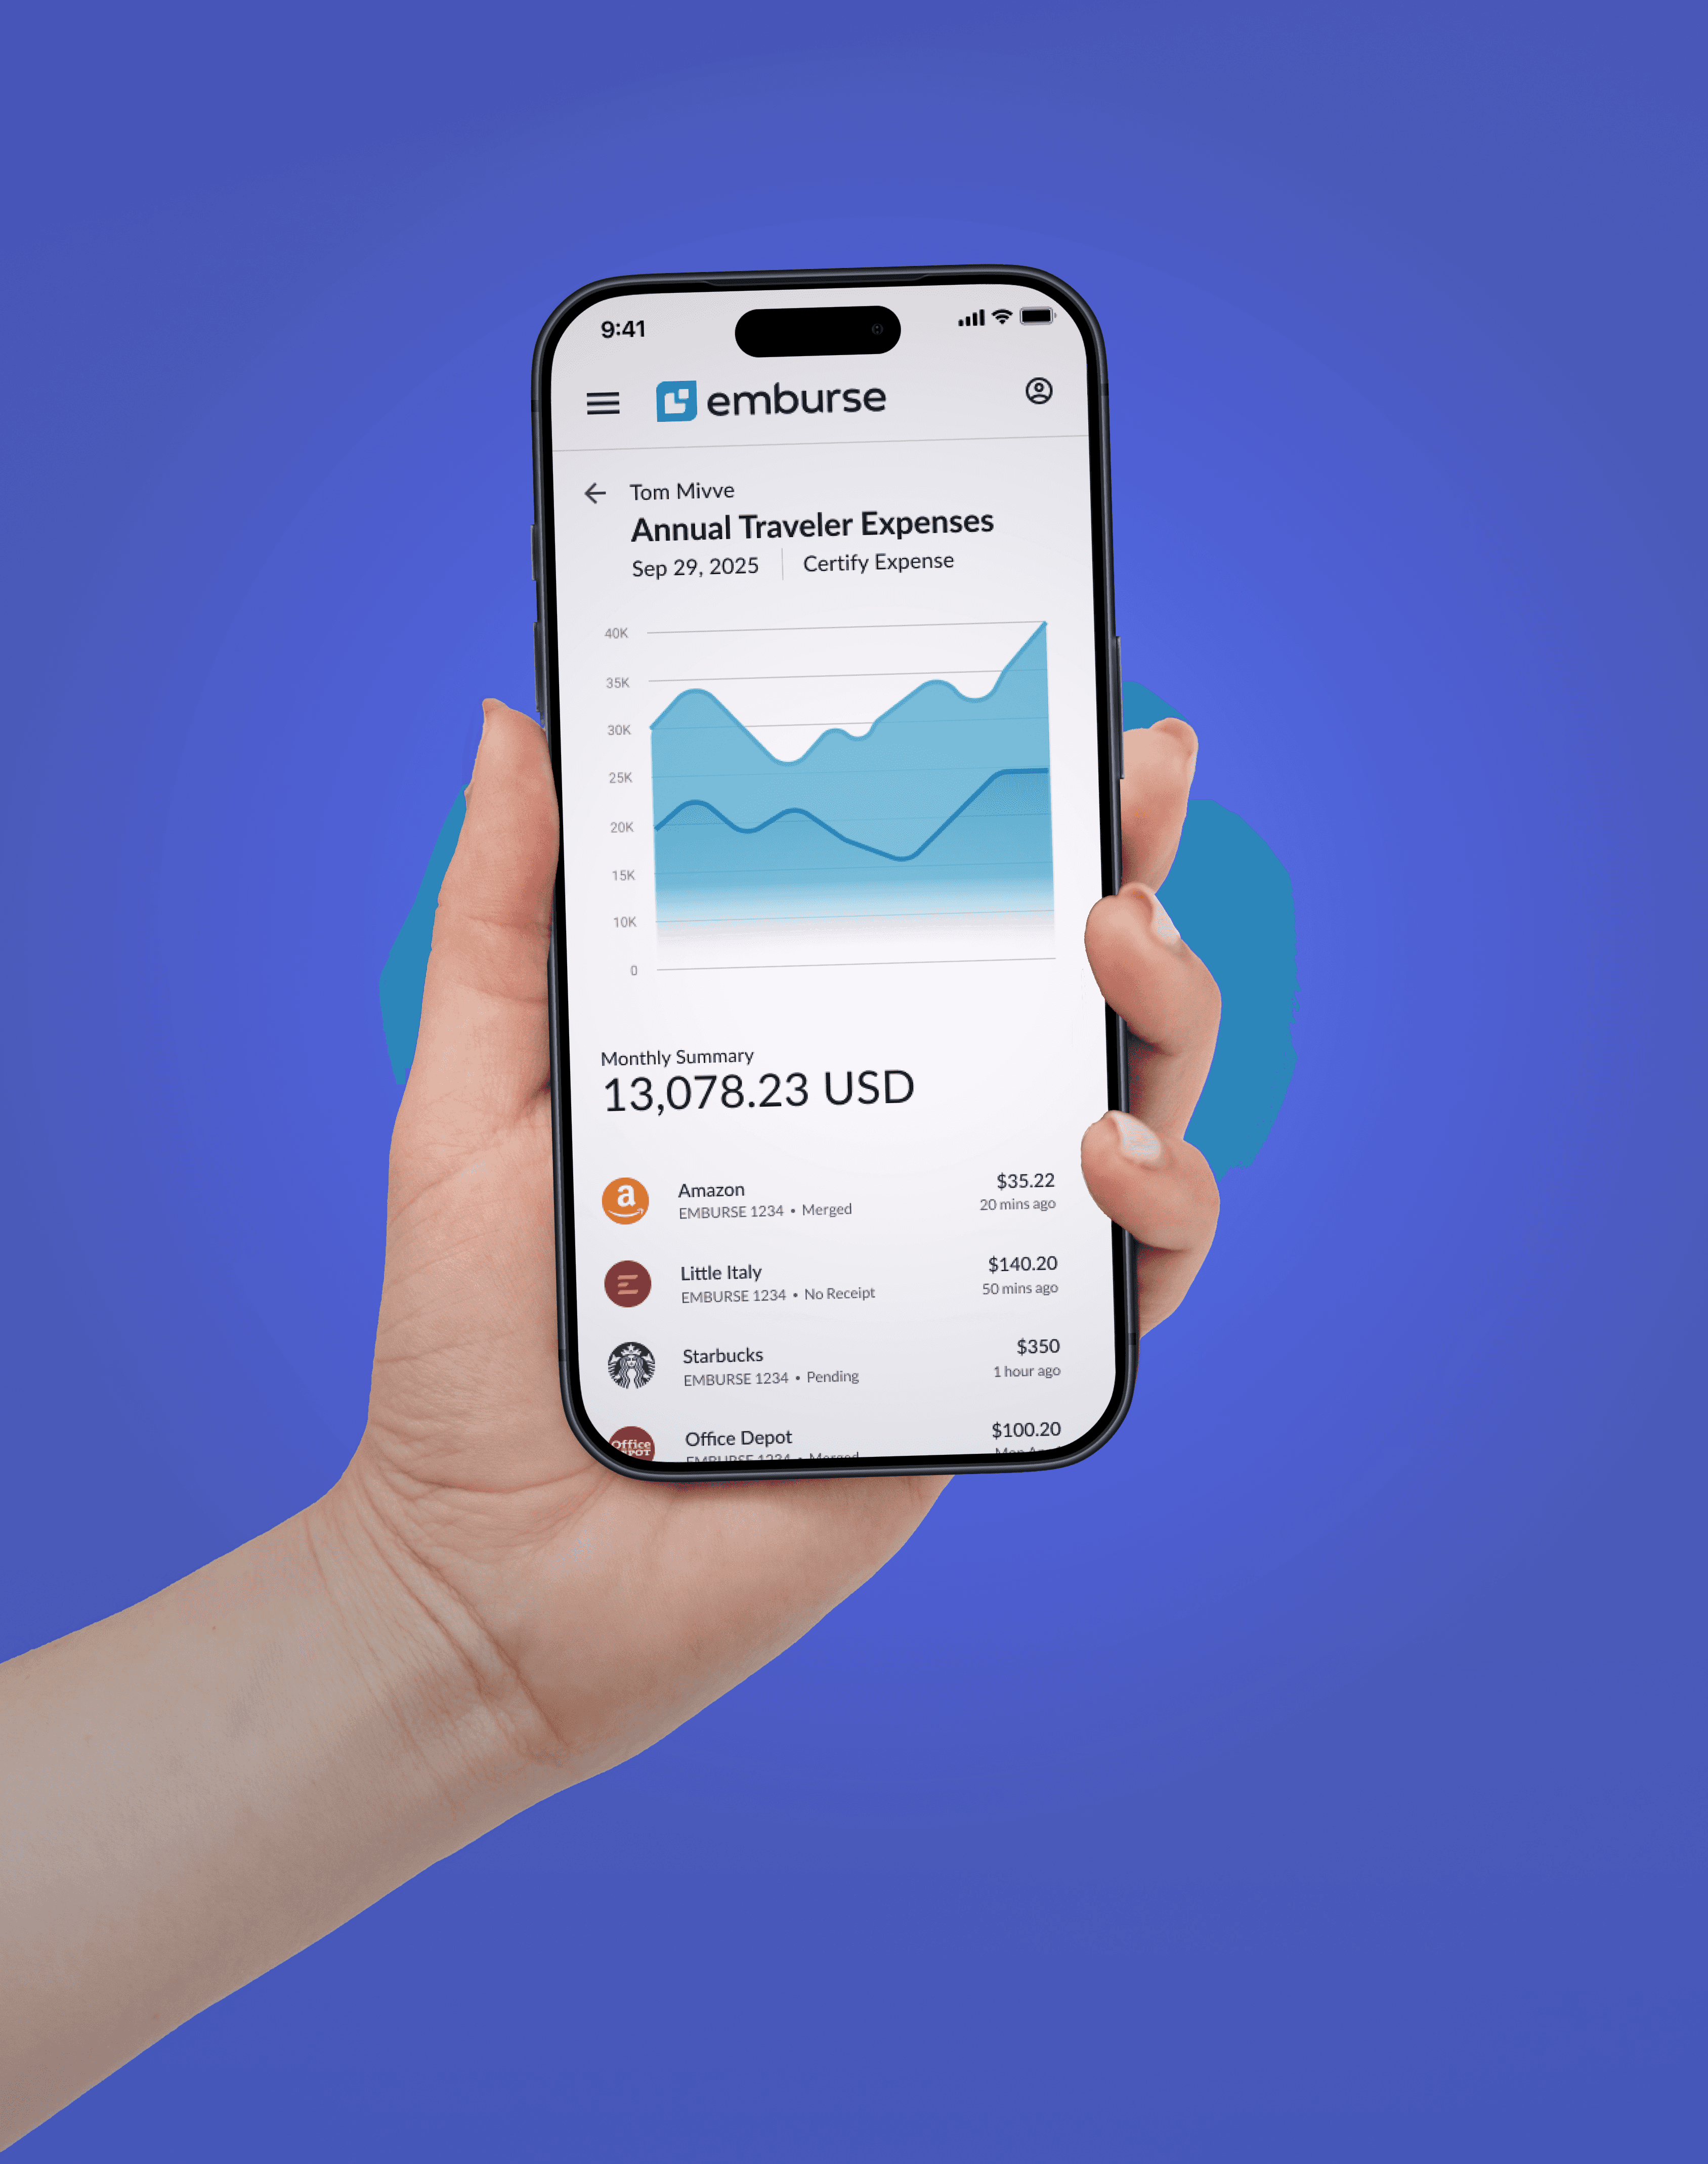
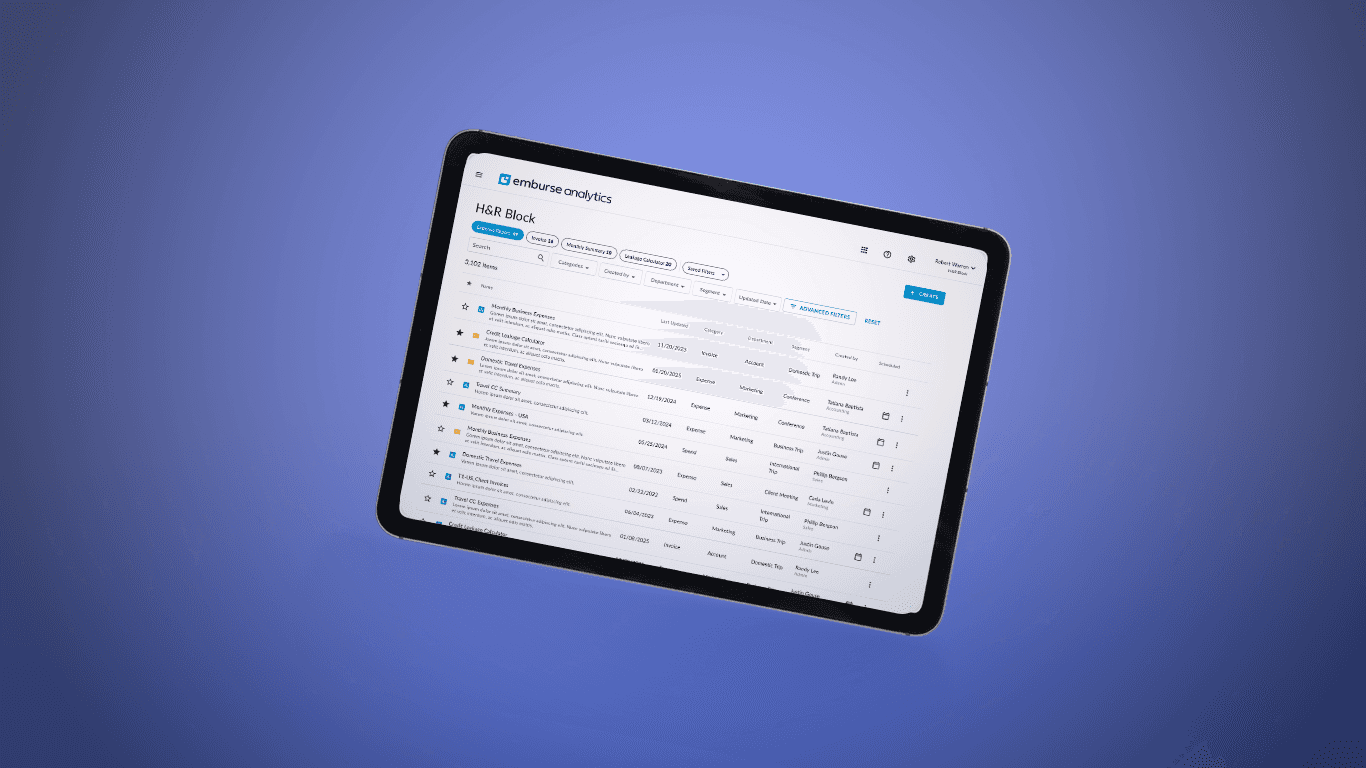
Redesigned entire app by rebuild data architecture and declutter interface. Simple navigation with search, filter and sorting features for key data. Introduced dashboard that can overview favorited and recently visited data along side with presets to easier onboarding.
The improved onboarding process resulted in 40K+ monthly active users.
With new data structure and interface made report creation easy which led increase of 23% year to date revenue.

40K+
Monthly active users
23%
increase year to date revenue
$2.5M


